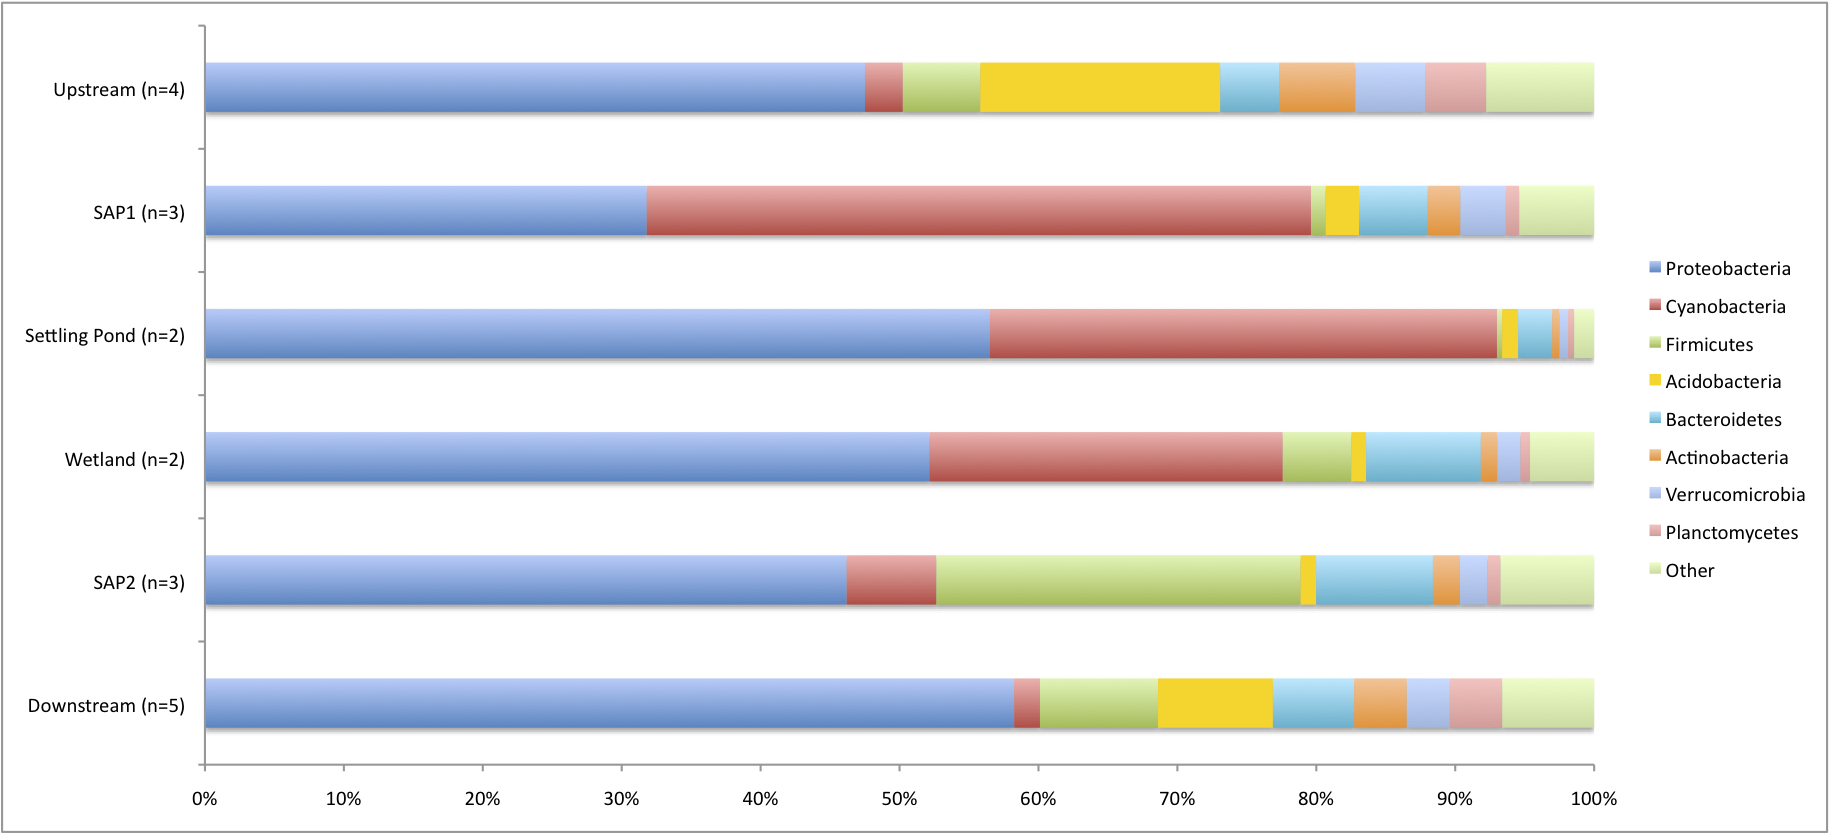
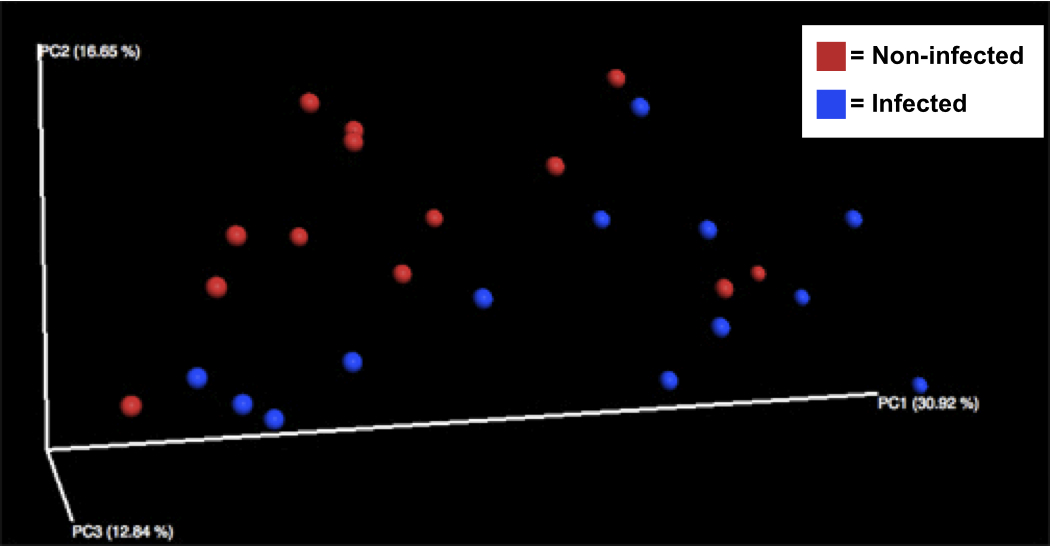
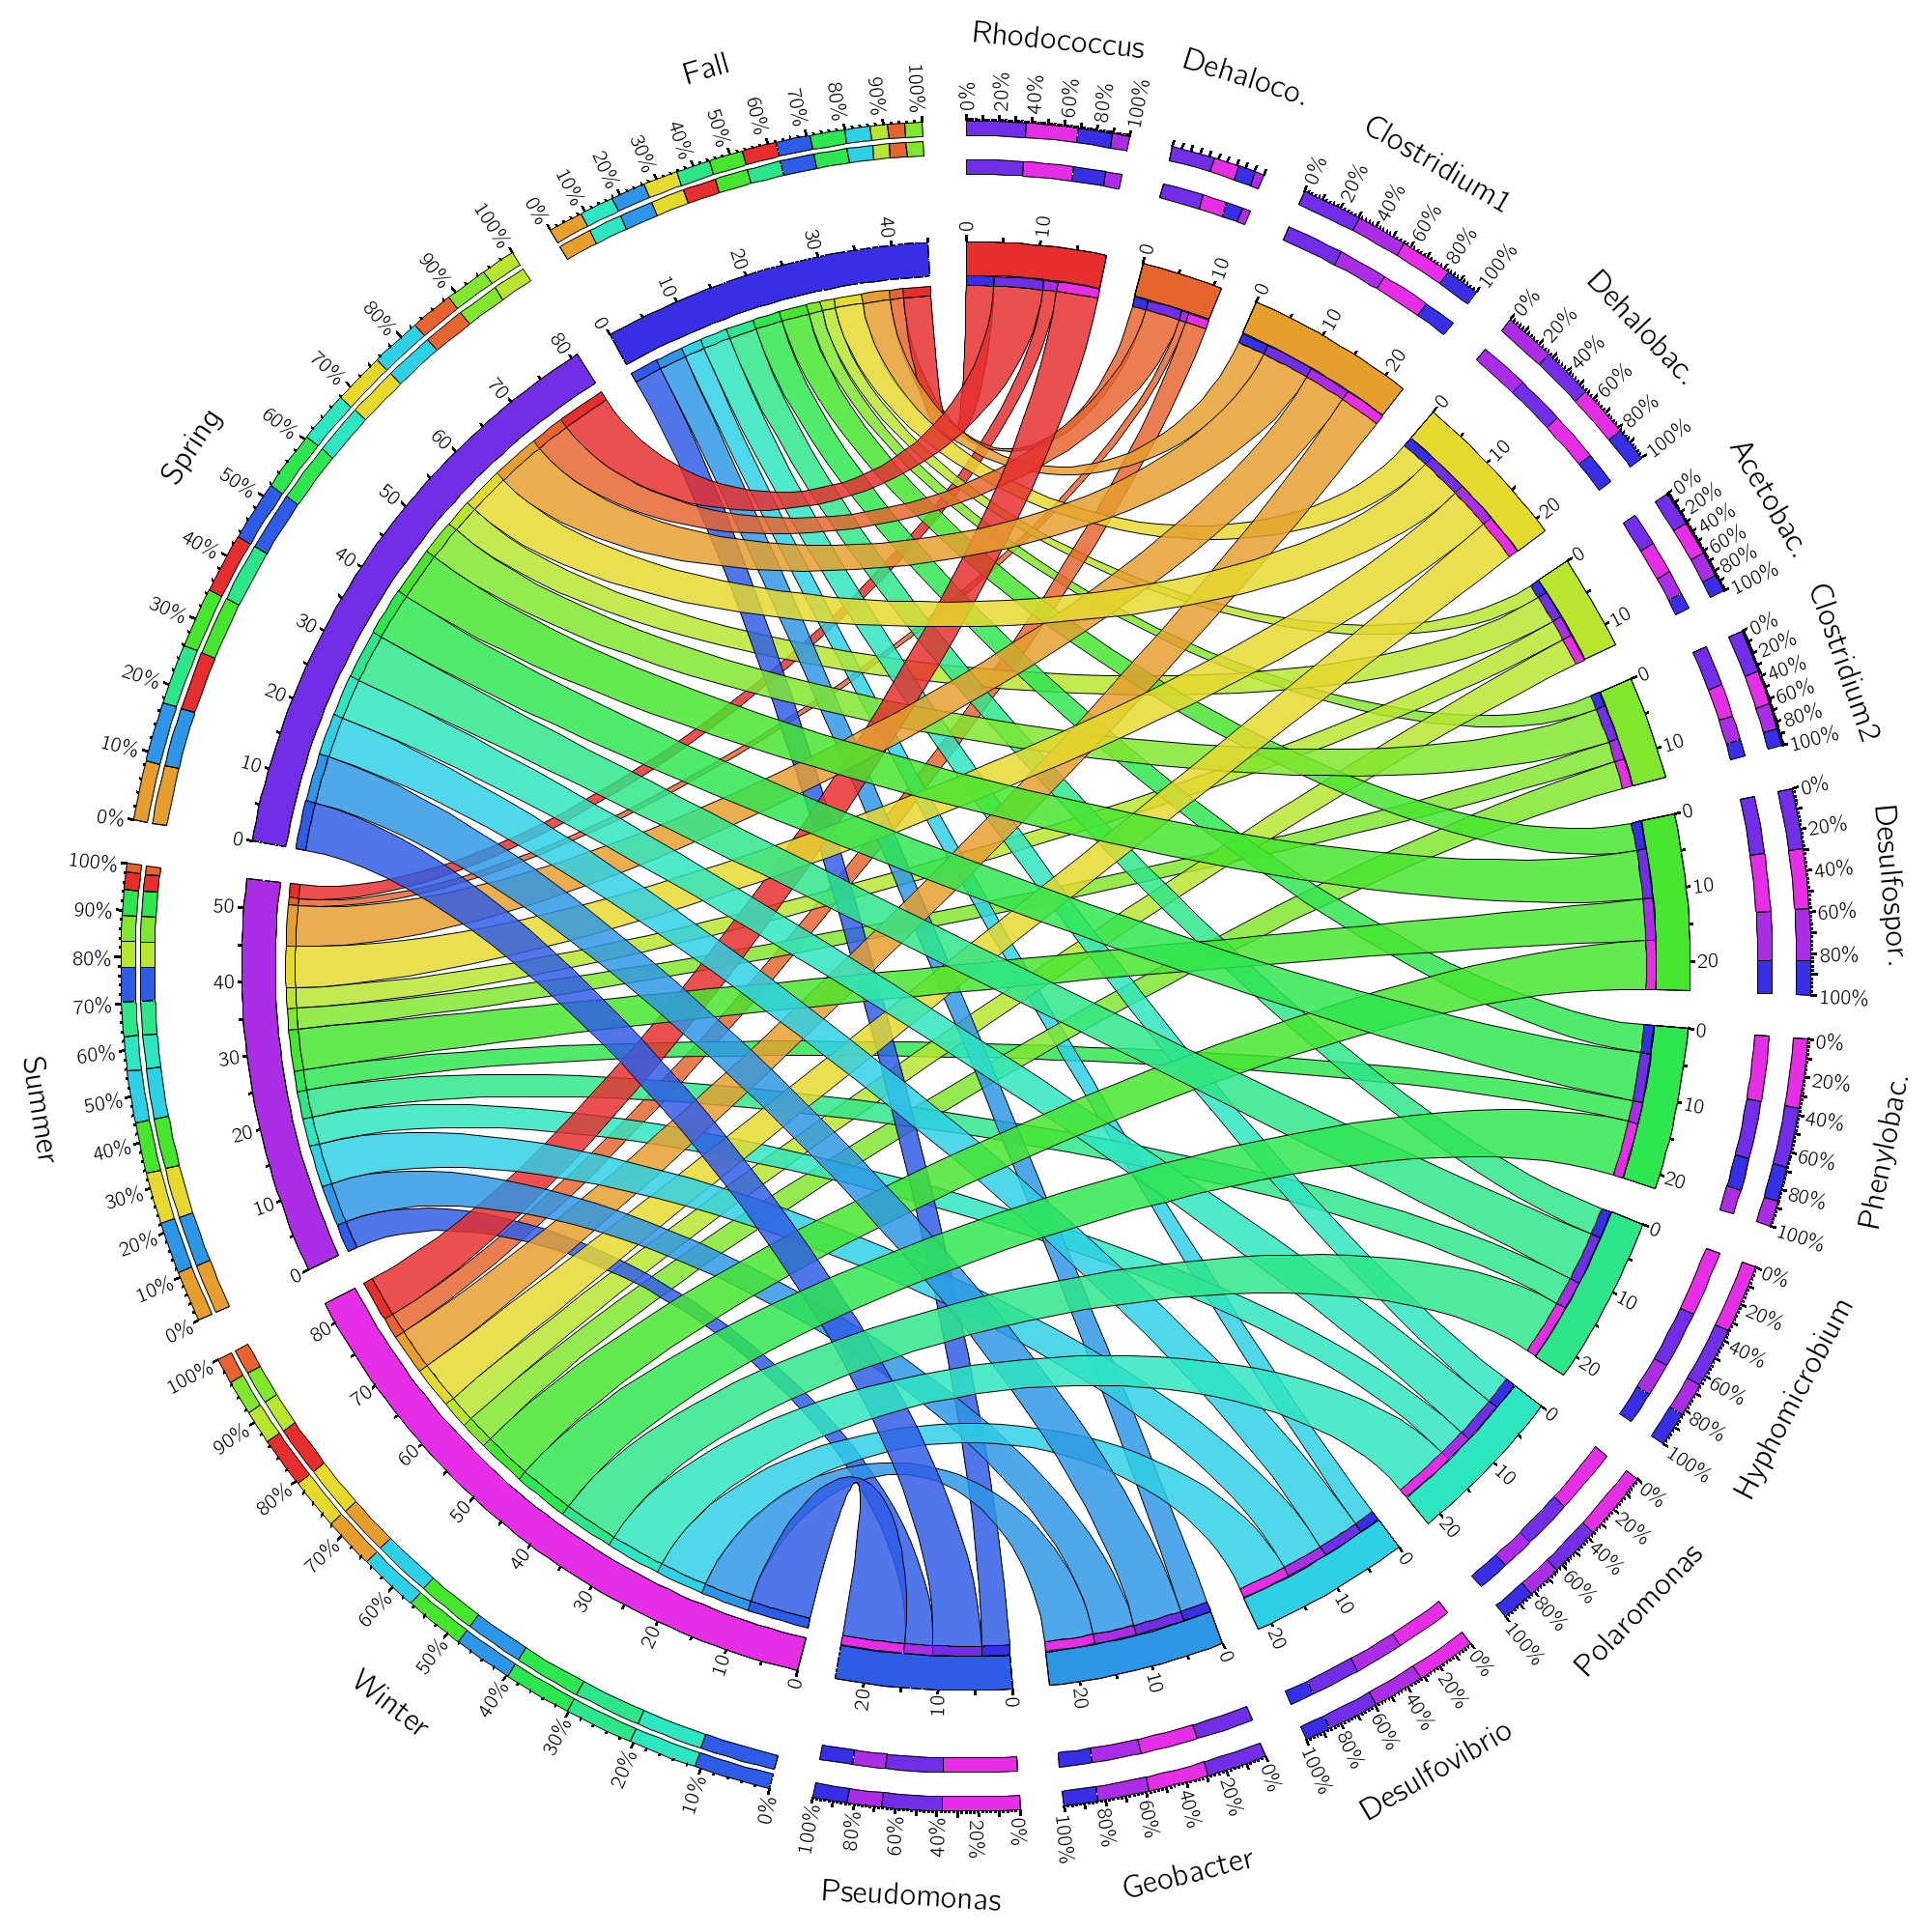
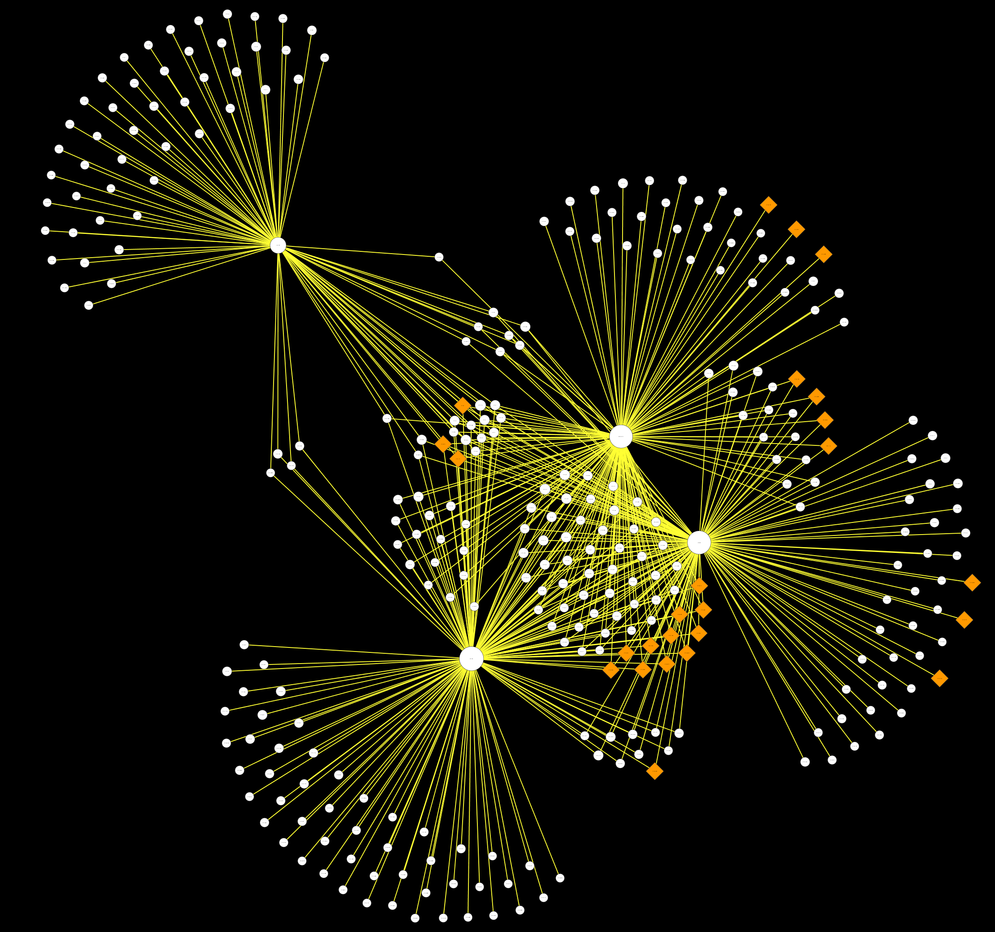
Through the targeting and sequencing of the 16S rRNA gene, we can "thumbprint" and quantify each bacteria that lives within your environmental sample. The data allow for a comprehensive snapshot of the microbial community, and how its structure changes in differential environments and conditions.
Starting at just $170 Per Sample
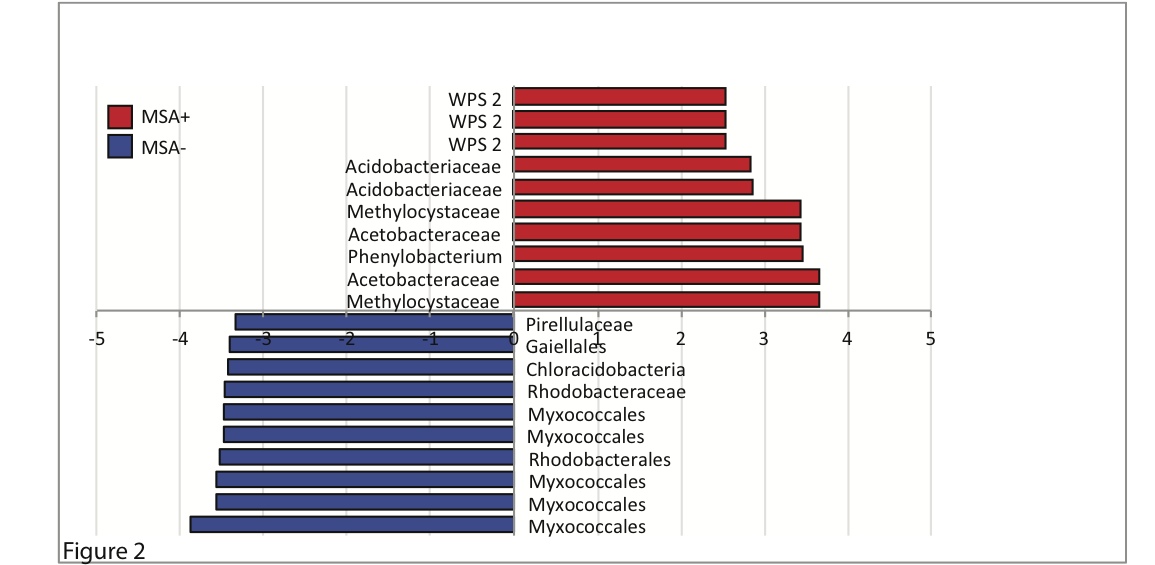
Example output we can generate for our collaborators:
![Relative Abundance Plots](https://images.squarespace-cdn.com/content/v1/53f62a6be4b0c49dae1360ab/1433521917812-YLJOZR7JA952DQMZK0O3/abundance_plot_phylum.jpg)
![Alpha Rarefaction Curves](https://images.squarespace-cdn.com/content/v1/53f62a6be4b0c49dae1360ab/1441031415755-K9EIRH8Z089ACYYBEAPU/alhpa_website.jpg)
![Beta Diversity PCoA Plots](https://images.squarespace-cdn.com/content/v1/53f62a6be4b0c49dae1360ab/1441031948158-K5BQ285LJJBC5IN0YRB9/beta_diversity_plot_updated_cdiff.jpg)
![Circos Plots](https://images.squarespace-cdn.com/content/v1/53f62a6be4b0c49dae1360ab/1433525607926-41DH6K2F0JJH3N8YOTXF/GENUSonly_circos_graph_Seasons.png)
![Network Analyses](https://images.squarespace-cdn.com/content/v1/53f62a6be4b0c49dae1360ab/1440443097678-ZIJFODYV7LRCK00NKK3M/DCM+group+5+%281%29.png)
![Network Analysis - Metabolism Prediction](https://images.squarespace-cdn.com/content/v1/53f62a6be4b0c49dae1360ab/1441032029272-SFX11LFOPJ3GXX8EJ3JC/DCM+EDEA+%282%29.png)
![Core Microbiome Analyses](https://images.squarespace-cdn.com/content/v1/53f62a6be4b0c49dae1360ab/1433521876833-LT1PUSHFD4EBKP0O4U8G/core_microbiome.jpg)
![LefSE Plots](https://images.squarespace-cdn.com/content/v1/53f62a6be4b0c49dae1360ab/1433521494709-R1M7PISFNVNG6Q66E99B/lefse_figure_in_paper.jpg)